Science · Foundations
Build a population, not a collection of personas.
Imagine All The People combines several complementary approaches: structured probabilistic models to represent selected dependencies between variables, and maximum-entropy methods to construct or adjust distributions under statistical constraints.
Two complementary inputs, one synthetic population.
Statistical data
Two complementary inputs:
This diagram represents a methodological architecture, not a single algorithm executed identically in every generation.
- 01Reference data
Relevant public data (INSEE at IRIS level, sector data, national surveys) and anonymized proprietary data where available.
- 02Constraints
Marginal and joint targets, translated into constraints on the model's expected frequencies.
- 03Maximum Entropy Relaxation
Exact cardinality constraints on a finite population are reformulated as constraints on the expected frequencies of a distribution. When the targets are compatible, these expectation constraints are satisfied at the optimum; a penalized formulation makes it possible to handle incompatible or noisy targets.
- 04Population
An exponential-family distribution over the space of complete attribute configurations, fitted through convex optimization. After a finite population has been sampled, empirical deviations from the targets are measured.
- 05Synthetic individuals
Complete attribute configurations sampled jointly from the fitted distribution, in a manner compatible with the selected statistical constraints and any structural rules that may be imposed.
- 06Interviews
Structured qualitative interviews with contextual follow-up on points of friction.
Structured probabilistic models
Not all population characteristics are generated independently. Imagine All The People also uses structured probabilistic models, including Bayesian networks, to explicitly represent selected dependencies between attributes.
For example, the distribution of a variable may depend on age, sex, region, urban or rural setting, or other characteristics already generated. These dependencies are defined using the available statistical sources and the model's explicit assumptions.
For an acyclic graph of variables V₁, …, V_d, the joint distribution can be factorized as follows:
- represents the population context.
- denotes the parent variables on which .
The graph's edges represent probabilistic dependencies used for generation. They must not automatically be interpreted as causal relationships.
Maximum Entropy Relaxation.
Two complementary levels
Probabilistic models make it possible to represent selected dependencies between a population's variables. The Maximum Entropy framework, in turn, makes it possible to construct or adjust a distribution when it must also satisfy a set of statistical constraints, including marginal or joint constraints involving several attributes.
This relationship can be formulated in general terms using a reference probability distribution q(x). We then seek a distribution p(x) that satisfies the constraints while deviating as little as possible from that reference distribution:
The solution takes the form of an exponential family:
When q is uniform over the allowed configurations, this formulation recovers the classical Maximum Entropy principle.
Reference probabilistic model → additional statistical constraints → distribution adjusted by entropic projection.
Some generation processes also use specific calibration procedures, count allocations and structural rules.
We start from reference data, translated into statistical constraints. A distribution over complete attribute configurations is fitted by maximum entropy under these constraints. A finite synthetic population is then sampled from this distribution and checked by measuring deviations from the targets.
Classical case: uniform referenceFormulation
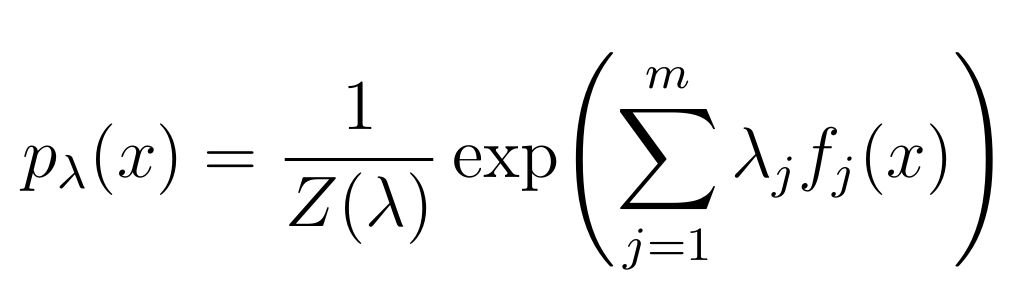
- pλ(x)probability of a complete attribute configuration x.
- fj(x)indicator function associated with attribute pattern j; the constraint applies to its expectation Ep[fj] = αj, where αj is the target frequency.
- λjLagrange multiplier associated with constraint j, obtained through dual convex optimization in the hard-constraint setting.
- Z(λ)normalization constant of the exponential family.
Among the distributions satisfying the selected constraints, choose the maximum-entropy distribution: the one that introduces the least additional information beyond what the constraints impose.
SourceFrançois Pachet, Jean-Daniel Zucker — Maximum Entropy Relaxation of Multi-Way Cardinality Constraints for Synthetic Population Generation, ArXiv (preprint, not peer reviewed) — 2026 — ArXiv:2603.22558 View
The maximum-entropy principle originates with Jaynes (1957). In constraint programming, Régin (1996) provides the classic reference for the Global Cardinality Constraint on unary cardinalities; multi-attribute constraints are formulated here as sum constraints over attribute patterns.
In mathematical terms
Imagine All The People draws on several established families of statistical modelling tools:
- probabilistic graphical models and conditional distributions to make selected dependencies explicit;
- exponential families to represent distributions under constraints;
- maximum entropy and Kullback–Leibler divergence minimization to adjust a reference distribution to new statistical information;
- calibration and checks of deviations in marginal and joint distributions.
The aim is not to infer a causal structure automatically, but to construct a probabilistic population whose assumptions and constraints are explicit and measurable.
Matching each variable does not mean matching their cross-distributions.
Conceptual illustration. A generation process that reproduces each marginal distribution separately can nevertheless produce joint attribute distributions that differ substantially from the reference data. The selected constraints therefore also cover joint distributions.
A population is not an average.
The population retains diversity consistent with the selected constraints: each synthetic individual is a complete configuration of attributes, queried in that specific configuration rather than as an average profile. Reading typologies are an analytical tool; the simulation continues to operate at the individual level.
Conceptual illustration. No real data are shown.
From the population to queryable individuals.
- 01Question
Interview protocol designed for the decision being studied.
- 02Answer
The synthetic individual responds from their own configuration.
- 03Contextual follow-up
Identified points of friction are explored rather than bypassed.
- 04Synthesis
Insights are delivered with links to the interviews that produced them.
Population structure
- Reference data
- Statistical constraints
- Calibration and deviation measurement
The LLM is an interaction layer
- Contextualized interview dialogue
- Linguistic register of the individual being interviewed
- Structured delivery of responses
The language model does not determine the statistical structure of the population. That structure is built and checked upstream on the explicitly modelled attributes. The LLM then generates responses conditional on each individual's configuration and the interview protocol; the behavioural validity of these responses is subject to separate validation.
- P(X)population structure built under constraints / MaxEnt.
- P(Y | X)responses generated by the LLM conditional on the attributes and protocol.
- P(Y) = x P(Y | x) P(X = x)P of Y equals the sum over x of P of Y given x, multiplied by P of X equals x.
Results that can be audited line by line.
- 01Result delivered to the client.
- 02Individual interviews that produced it.
- 03Population and constraints applied.
- 04Reference data and calibration report.
What the method does not claim
- The synthetic population does not predict a real person.
- A synthetic individual has not lived the real-world experience.
- Without reliable reference data, the result remains exploratory.
- A simulation does not replace a regulatory obligation.
- Satisfying the population's statistical constraints is not sufficient to establish the behavioural validity of the responses.
- A dependency between attributes that is not described by the data, constraints or structural rules is not guaranteed by the method.
Your next decision
Which decision do you want to explore?
Describe your need. We can point you to the right level of support.