RETAIL · ASSORTMENT & PRIVATE LABEL

« How do you remove 40 % of breakfast-aisle SKUs to launch a premium private label without driving away loyal customers? »

A European general retailer had spent eighteen months trying to improve the value of its breakfast aisle : structural margin 2 to 4 points below the category average, 12 to 15 linear meters of shelf space occupied, and little negotiating leverage with national brands.

The project : remove 40 % of SKUs to free 6 linear meters of shelf space for a premium private label. €12 million in investment, more than €8 million in projected annual margin. Commercial leadership would not commit the money without knowing what customers actually do when their product is no longer there.

In a supermarket breakfast aisle, a shopper seen from behind, basket in hand, reaches toward a shelf of packets and jars; the products are visible but not identifiable.
SIMULATED SHOPPERS
2.8 million
ASSORTMENT CONFIGURATIONS TESTED
34
SHOPPING-BEHAVIOR TYPOLOGIES
19
PROJECTION HORIZON
12 weeks

THE PROBLEM

Remove 40 %
of SKUs
does not come down
to remove 40 %
to choice
equivalent.

Assortment rationalization aims to improve clarity, increase rotation, simplify operations and create the space needed for a higher-margin premium private-label range. But not every SKU plays the same role in the shopping missions of the people who buy it.

Two competing retailers had recently redesigned their breakfast aisles. One increased margin without losing traffic. The other triggered a sustained decline in visits across the entire affected store area. The same apparent decision, two outcomes.

Internal customer studies, built on stated panel responses, could not resolve the question : how many shoppers really switch, how many stay with a smaller basket, how many move their purchase to the private label, and how many transfer the frustration to adjacent categories.

WHAT THE DECISION HAD TO SOLVE

  • THE AISLE12 to 15 linear meters of shelf space, with a structural margin 2 to 4 points below the category average
  • THE PROJECTremove 40 % of national-brand SKUs to free 6 linear meters of shelf space for a premium private label
  • THE INVESTMENT€12 million: packaging, sourcing, launch campaign, transition costs
  • PROJECTED GAINmore than €8 million in annual margin at maturity, with payback in 18 months
  • THE FEARED RISK68 % of shoppers in the aisle say they would switch retailers if their favorite SKU disappeared

A MECHANISM : WHAT PEOPLE SAY IS NOT WHAT THEY DO

They said
they would leave.
What they did
a friction.

WHAT PEOPLE SAY, WHAT THEY DOSAY THEY WOULD SWITCH RETAILERS68 %ACTUALLY DO SO, IN A 12-WEEK SIMULATION11 %AN ASSORTMENT GAP CREATES FRICTION, NOT A BREAKUPTHE CRITICAL THRESHOLD IS THEREFORE NOT THE DEPARTURE RATE

68 % of shoppers in the aisle say they would switch retailers if their favorite SKU disappeared. In a 12-week behavioral simulation, 11 % do. The gap is structural : shoppers anticipate a frustration they do not act on, because the real cost of switching retailers exceeds the actual frustration caused by one aisle.

That gap does not eliminate the risk. It shifts where to look for it.

A DISTINCTION : ROTATION VS LOYALTY VALUE

One SKU
may matter little
in the aisle
and much more
in the relationship.

Traditional assortment analysis looks at sales, rotation and margin. It does not show what a SKU does to the shopping mission of the person buying it. Three shopper typologies represent 8 % of aisle customers and 14 % of its revenue : once their SKU is removed, their trajectory remains negative at 12 weeks. The revenue line did not reveal their weight.

  • TYPOLOGIES ASEVEN TYPOLOGIES, 4 TO 6 WEEKSpremium private-label adoption and category-basket growth
  • TYPOLOGIES BNINE TYPOLOGIES, 8 TO 14 WEEKSslower adaptation, stable category basket
  • TYPOLOGIES CTHREE TYPOLOGIES, SUSTAINED NEGATIVE TRAJECTORY8 % of aisle customers, 14 % of revenue, −22 % category basket at 12 weeks

WHAT IS TESTED

Thirty-four
architectures
assortment configurations,
not thirty-four
planograms.

The 34 configurations tested vary more than one parameter. They combine reduction depth, affected product families, signage, shelf positioning, price gap and deployment sequence.

  1. 01NUMBER OF SKUS RETAINEDThe depth of the reduction, tested through incremental variations around the 40 % target.
  2. 02MOST AFFECTED CATEGORIESWhich product families absorb the reduction, and which are preserved.
  3. 03DEDICATED PRIVATE-LABEL SIGNAGEPresence or absence of distinctive shelf space, premium-coded packaging and catalog promotion.
  4. 04SHELF POSITIONING AND PRICE GAPRange placement and price gap versus national brands.
  5. 05DEPLOYMENT SEQUENCESimultaneous switch or introduction of the private label before the gradual removal of national brands.

4,200 synthetic shoppers were interviewed individually in a simulated aisle environment, exposed to the 34 configurations through incremental variations, with follow-up questions at identified tipping points and modeled purchasing trajectories across the 7 adjacent categories.

The customer base
of one aisle
is not shared
between loyal
and non-loyal shoppers.

The reconstructed population covers 2.8 million shoppers at the retailer, calibrated on proprietary data — loyalty cards, anonymized receipts and behavioral panels — and public sector data. No personally identifiable data entered the system.

It is structured into 19 breakfast shopping-behavior typologies combining purchase frequency, price sensitivity, brand attachment, household structure, multi-retailer mix and sensitivity to assortment gaps.

  • PURCHASE FREQUENCY

    2.8 million shoppers at the retailer, from weekly visitors to occasional buyers

  • PRICE SENSITIVITY

    on its own, it does not predict the reaction to a SKU disappearing

  • BRAND ATTACHMENT

    from easy substitution to exclusive loyalty to one specific national brand

  • HOUSEHOLD STRUCTURE

    the same basket can contain multiple preferences within the household

  • MULTI-RETAILER MIX

    some households already shop at several retailers, others at only one

  • SENSITIVITY TO ASSORTMENT GAPS

    population calibrated on loyalty-card data, anonymized receipts and sector panels

These configurations reveal part of the population's heterogeneity. The simulation operates on synthetic individuals, not a handful of persona types.

REACTIONS

The same removal
of SKUs,
introduced differently,
does not produce
the same shopping trip.

  1. 01

    STATED INTENT MASSIVELY OVERSTATES SWITCHING

    68 % of shoppers say they would switch retailers if their favorite SKU disappeared. In a 12-week behavioral simulation, 11 % actually do. The real cost of changing retailers — habits, distance, coherence of the rest of the shopping trip — exceeds the actual frustration caused by one aisle. The vast majority try the private label, choose an alternative, or adjust their habits.

  2. 02

    THE REAL RISK SITS IN THE ADJACENT CATEGORY

    Shoppers frustrated in breakfast also reduce their basket across seven adjacent categories — sweet biscuits, hot drinks, spreads, fresh dairy products, packaged pastries, jams and dietary products — for 8 to 12 weeks, with an average 14 % decline in category basket value. The cumulative cross-category loss exceeds the additional margin generated by the premium private label.

  3. 03

    DEPLOYMENT SEQUENCE CHANGES THE OUTCOME

    An abrupt switch — removal and introduction simultaneously in week 0 — achieves 34 % shopper acceptance. A gradual switch — premium private label in week 0, national brands removed between weeks 4 and 12 — achieves 71 %. A shopper who discovers the private label while established brands are still present can adopt it by choice; one who discovers it only after those brands have been removed experiences it as a constrained choice and transfers frustration to other categories.

  4. 04

    SIGNAGE MATTERS MORE THAN A PRICE CUT

    Two strategies with equivalent cost to the retailer were compared: a premium private label at −15 % versus national-brand prices without dedicated signage, and the same offer at −5 % with distinctive shelf space, premium-coded packaging, end-cap placement and catalog promotion. The second, despite being more expensive for the shopper, gains an additional 24 points of adoption and 31 points of perceived quality.

  5. 05

    THE 19 TYPOLOGIES DO NOT ADAPT AT THE SAME SPEED

    Seven typologies — retailer-loyal shoppers, health-led shoppers, families with children — adopt the premium private label within 4 to 6 weeks and increase their category basket. Nine typologies — price shoppers, habit-driven shoppers, seniors — adapt within 8 to 14 weeks with a stable basket. Three typologies — ultra-loyal customers of a specific national brand, occasional shoppers sensitive to assortment gaps, multi-retailer families — lose 22 % of category basket value, with the loss still present at 12 weeks.

A MECHANISM : THE LOSS IS NOT WHERE YOU LOOK FOR IT

The gain happens
in one aisle.
The risk happens
in seven others.

THE TARGET AISLE, THEN THE REST OF THE SHOPPING JOURNEYBREAKFAST AISLE — USUAL SKU MISSINGSWEET BISCUITS−14 %HOT DRINKS−14 %SPREADS−14 %FRESH DAIRY PRODUCTS−14 %PACKAGED PASTRIES−14 %JAMS−14 %DIETARY PRODUCTS−14 %AVERAGE DECLINE IN CATEGORY BASKET ACROSS THE 7 ADJACENT AISLES, FOR 8 TO 12 WEEKS

A shopper does not come to buy one SKU : they come to do their shopping. Frustration at one point in the journey transfers to the next points. Shoppers frustrated in breakfast reduce their basket by an average of 14 % across seven adjacent categories for 8 to 12 weeks.

The cumulative cross-category loss exceeds the additional margin generated by the premium private label in the original aisle. This finding invalidated the abrupt-switch strategy initially being considered.

A DISTINCTION : NEW OPTION VS FORCED CHOICE

The same private label,
discovered
at two different
moments,
is not
the same product.

A shopper who discovers the premium private label while established brands are still on the shelf can adopt it by choice. A shopper who discovers it after those brands have been removed experiences it as a forced choice : frustration is then transferred to other categories. The product is identical. Its interpretation is not.

  • WHAT THE QUESTION APPEARED TO BEhow many SKUs can be removed from the breakfast aisle
  • WHAT THE SIMULATION REVEALSwhat happens to the rest of the shopping journey when an expected SKU is no longer there
  • THE GAPthe cumulative loss across the 7 adjacent aisles exceeds the additional margin generated by the premium private label in the target aisle

A MECHANISM : SEQUENCE IS A DECISION VARIABLE

Same final
assortment.
Two different
acceptance levels.

A — ABRUPT SWITCHWEEK 0 — REMOVE 40 % OF SKUSWEEK 0 — SIMULTANEOUS INTRODUCTION OF THE PREMIUM PRIVATE LABELTHE PRIVATE LABEL IS DISCOVERED AFTER THE REMOVAL34 % SHOPPER ACCEPTANCEB — GRADUAL SWITCH OVER 12 WEEKSWEEK 0 — INTRODUCTION OF THE PREMIUM PRIVATE LABELWEEKS 4 TO 12 — GRADUAL REMOVAL OF NATIONAL BRANDSTHE PRIVATE LABEL IS DISCOVERED WHILE ESTABLISHED BRANDS ARE STILL PRESENT71 % SHOPPER ACCEPTANCESAME ASSORTMENT DECISION, SAME PRIVATE LABEL — ONLY THE SEQUENCE CHANGES

34 % shopper acceptance for the abrupt switch, 71 % for the gradual switch over 12 weeks. The final aisle composition is the same. Only the order of operations changes.

The gradual switch also preserves the basket across adjacent categories, where the abrupt switch degrades it.

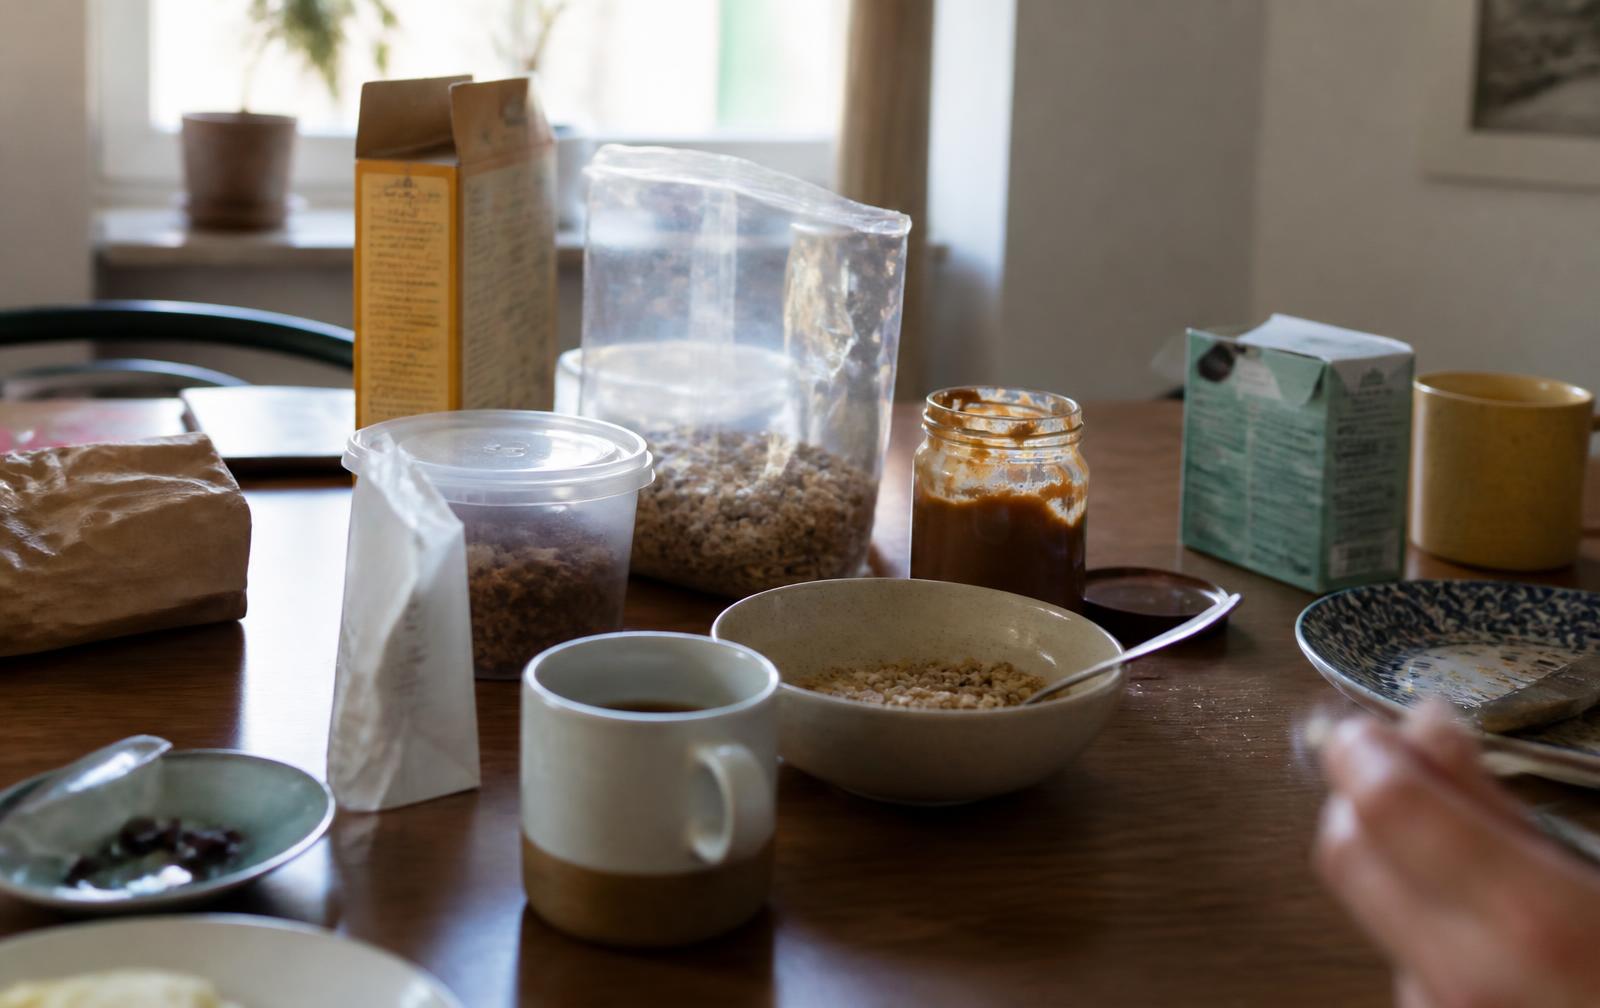
An ordinary breakfast table in a kitchen: several open packets and jars, a bowl of cereal, a cup of coffee, a box of tea, mismatched dishes, no identifiable brands.
One household, multiple preferences : one basket does not express a single habit.

COMPARISON

The architectures tested,
assessed across four dimensions.

ARCHITECTURESEQUENCEPREMIUM PRIVATE LABELACCEPTANCEDOCUMENTED EFFECT
01Abrupt switchsimultaneous removal and introduction in week 0−15 % price gap, no dedicated signage34 %adjacent-category basket declines, −14 % for 8 to 12 weeks
02Low-priced premium private labelnot published−15 % versus national-brand prices, without signagenot published24 pts lower adoption, 31 pts lower perceived quality
03Signaled premium private labelnot published−5 %, distinctive shelf space, premium packaging, catalognot publishedhigher adoption and perceived quality, at equivalent cost to the retailer
04Gradual switchprivate label in week 0, national brands removed between weeks 4 and 12not published71 %adjacent-category basket preserved
05Gradual, dedicated signage, targeted retention12 weeks, then freeze minor adjustments−5 % with premium signage71 %+8,2 pts cumulative margin at 12 weeks vs abrupt switch

Only dimensions for which the case documents measurements carry numerical values. “Not published” is retained rather than replaced by an estimate.

PREMIUM SIGNAGE, −5 %

Recognition adoption : +24 pts adoption, +31 pts perceived quality

PRICE GAP, −15 %

Price promise trade-off : equivalent cost to the retailer, lower adoption

THE STRATEGY SELECTED

A reduction
spread over time,
a clearly signaled private label,
three brands
retained.

The executive committee approved the dominant strategy : a gradual switch over 12 weeks, dedicated premium private-label signage — distinctive shelf space, premium packaging, catalog promotion —, a moderate −5 % price gap instead of the −15 % initially considered, and targeted retention through occasional promotional listing of the three critical national brands identified.

The €12 million budget was maintained, with spending reallocated toward premium packaging and shelf signage instead of the promotional campaigns initially planned. The plan was presented to the retailer's 320 store managers, with three months of field support.

DECISION

What the decision
selected.

TO SEQUENCE
Introduce the premium private label before removing the SKUs, not on the same day.
TO INVEST IN
Signage and premium codes rather than a larger price gap, at equivalent cost.
TO PROTECT
The three critical typologies, through occasional promotional listing of the relevant national brands.
TO MONITOR
The basket across the 7 adjacent aisles, not only performance in the target aisle.
TO FREEZE
Minor assortment adjustments for at least 6 months after the switch.

PROJECTION, THEN OBSERVATION

Eighteen months
after deployment.

Deployment began six months after the decision, once the premium private-label range had been industrialized. Over the first 24 weeks, the commercial trajectory tracked the projections with an average deviation below 6 %. The premium private label captured 42 % of aisle revenue at 6 months, above the 38 % projection.

At 18 months, breakfast-aisle margin had increased by 18 points, above the projected 15 points. The cross-category basket across the 7 adjacent aisles was up 2,8 % over the year. No lasting customer loss was detected : the aisle churn rate was exactly in line with the retailer's average rate. Three episodes of local pushback were recorded in stores where premium signage had not been deployed correctly.

These values describe what was observed after the decision. They do not establish exclusive causality between the strategy selected and each of these movements.

BREAKFAST-AISLE MARGIN AT 18 MONTHS
+18 pts, versus +15 pts projected
PREMIUM PRIVATE-LABEL SHARE AT 6 MONTHS
42 % of aisle revenue, versus 38 % projected
BASKET ACROSS THE 7 ADJACENT AISLES
+2,8 % over the year, versus a flat projection
AISLE CHURN RATE
in line with the retailer's average rate

A TIME DYNAMIC : ROUTINES REBUILD SLOWLY

After a
switch,
every small
ajustement
reopens the wound.

The system simulated routine assortment adjustments after stabilization : removing a low-performing SKU, introducing a new product, changing format. During the 6 months following a major switch, each minor adjustment reactivates the negative cross-category effect for 3 to 5 weeks. Routine assortment rotation therefore needs to be frozen, which runs counter to standard retail management.

  • WEEKS 0 TO 12introduce the private label, then gradually remove national brands
  • WEEKS 8 TO 14nine typologies adapt, three remain on a negative trajectory
  • NEXT SIX MONTHSfreeze minor adjustments : each would reactivate the cross-category effect for 3 to 5 weeks

TAKEAWAY

Some SKUs
faisaient
of the figure.
Others
brought back
customers.

The problem was not removing 40 % of SKUs. It was identifying the ones whose removal shifts far more than their own revenue line : three shopper typologies, 8 % of aisle customers and 14 % of its revenue, whose trajectory remains negative at 12 weeks when their brand disappears.

Reducing assortment is a means, not an outcome. The decision should be read through private-label adoption, the basket in adjacent aisles, loyalty and repeat visits — not the number of SKUs removed. Customers do not consume an assortment : they consume routines.

POSSIBLE FUTURES

The same final aisle.
Three ways to get there.

A

ABRUPT SWITCH

−40 % of SKUs and premium private label on the same day

  • immediate aisle simplification and maximum space for the private label
  • 34 % shopper acceptance
  • the private label is perceived as a forced substitution
  • basket across the 7 adjacent categories down 14 % for 8 to 12 weeks

B

PRICE RATHER THAN SIGNAGE

premium private label at −15 % versus national-brand prices, with no distinctive shelf space

  • same cost to the retailer, promise carried by price
  • 24 points lower adoption
  • 31 points lower perceived quality
  • premium recognition matters more than the price promise in this category

C

GRADUAL, SIGNALED, WITH TARGETED RETENTION

private label in week 0, removals between weeks 4 and 12, dedicated signage, critical brands retained

  • 71 % shopper acceptance
  • adjacent-category basket preserved
  • +8,2 pts cumulative margin at 12 weeks vs abrupt switch
  • freeze minor assortment adjustments for 6 months

METHOD

Before removing,
we had
the shopping trip.

  1. 2.8 MILLION SYNTHETIC SHOPPERS
  2. 19 SHOPPING TYPOLOGIES
  3. 34 ASSORTMENT CONFIGURATIONS
  4. 4,200 SHOPPERS INTERVIEWED IN A SIMULATED AISLE
  5. SUBSTITUTIONS AND NEW ROUTINES
  6. CROSS-CATEGORY EFFECT ACROSS 7 AISLES
  7. 12 WEEKS
  8. DECISION

2.8 million synthetic shoppers calibrated on the retailer's proprietary data and sector panels, 19 shopping-behavior typologies, 34 assortment configurations presented to 4,200 shoppers interviewed in a simulated aisle, then projected over 12 weeks : 258 distinct trajectories by category and typology, more than 34,000 combinations evaluated in total, including cross-category effects.

This case adds a mechanism to the library : the value of one element in a system can be indirect. A SKU may account for little in its aisle but matter greatly to the relationship with the retailer. The system simulates its removal, substitution or absence, the new routine, possible switching to another retailer, and the evolution of the overall basket — beyond SKU performance alone.

A real case.
An unnamed retailer.

This case is based on a completed simulation for a European general retailer. The client is not named, no personally identifiable data entered the system, and the detailed results remain the client's property.

The simulation does not choose which SKUs to remove, the composition of the private-label range, or the retailer's pricing policy. It examines the consequences, across different populations, of several assortment architectures and several deployment sequences.

Your next decision

Which decision do you want to explore?

Describe your need. We can point you to the right level of support.

What if you tested
your next decision?

State your decision. See the future it produces.

Explore the product