URBAN PLANNING & MOBILITY · DEVELOPMENT

“ How can a new mixed-use neighborhood be designed on an industrial brownfield so that social mix holds at 10 years ? ”

A French developer was preparing the program for a new mixed-use neighborhood on 24 hectares of industrial brownfield in the metropolitan core : 2 800 homes, divided into 30 % social housing, 20 % intermediate housing and 50 % market-rate housing, with public facilities, retail space and tertiary activities.

Programming can create social mix on day 1. The question was different : what mechanisms will ensure that different populations are still living in the same neighborhood ten years later ?

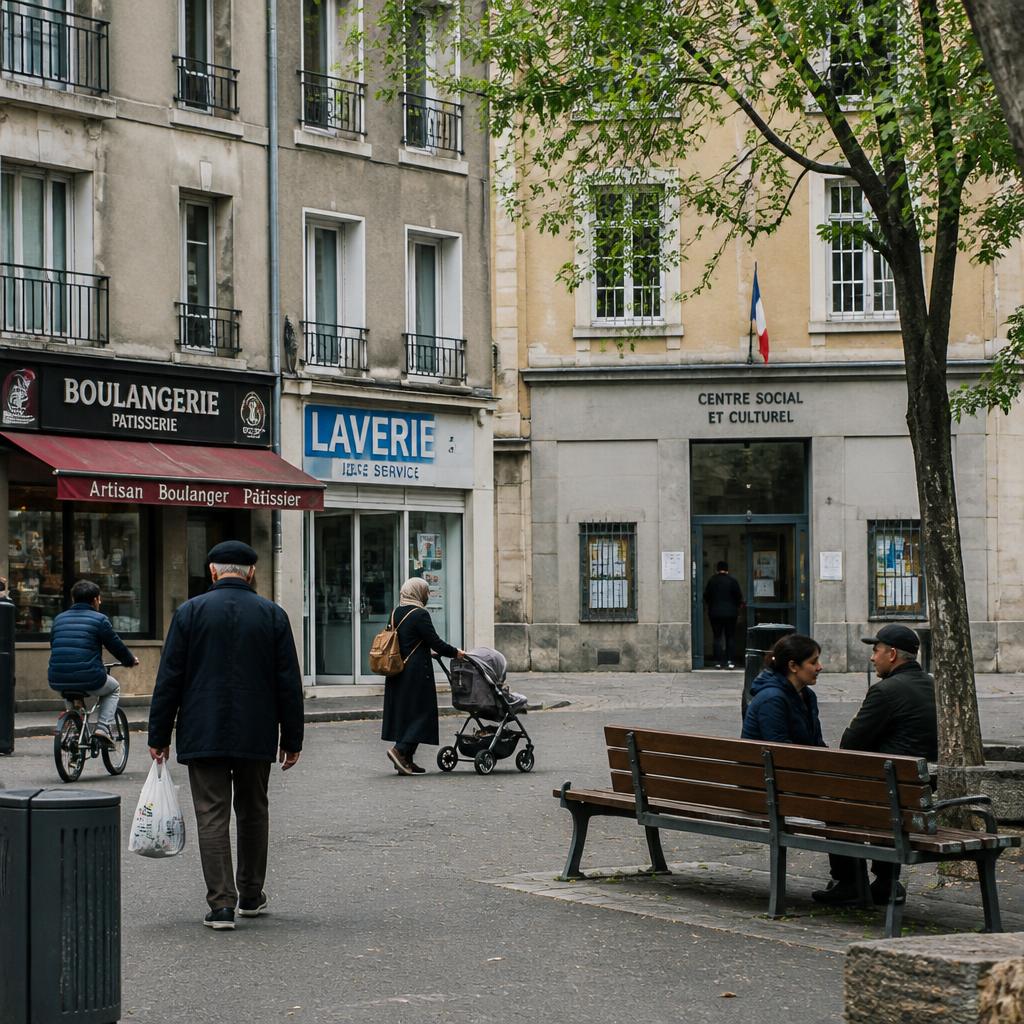
A lived-in urban neighborhood square in late afternoon: buildings of different ages, a bakery, laundromat, social and cultural center, an elderly man with groceries, a child on a bicycle, a woman pushing a stroller, two people sitting on a bench.
DECISION
Choose the program for a new 24-hectare mixed-use neighborhood on a redeveloped industrial brownfield
POPULATION
1,4 million residents and workers in the metropolitan area, 18 profiles of relationship to social mix
WHAT IS TESTED
6 urban-programming configurations
HORIZON
120 months of projected population trajectory

THE PROBLEM

Programmed social mix
is not
lasting social mix.

The political ambition was to create a neighborhood with lasting social mix, against the classic mechanism of social specialization in new neighborhoods. The known risk was drift from programmed social mix toward specialization at 10 years.

Several comparable projects in other French metropolitan areas had seen their initial social mix erode : either through progressive impoverishment as market-rate households left, or through progressive gentrification displacing lower-income households. These trajectories are not inevitable ; they are documented.

The mechanisms involved had been identified — perceived quality of public facilities, school, perceived safety, retail dynamics — but their interactions were not understood. The project team used our system to test 6 urban-programming configurations, with population trajectories projected over 120 months.

WHAT IS THE SAME FOR EVERYONE

  • 24 hectares of industrial brownfield redeveloped in the metropolitan core
  • 2 800 planned homes
  • 30 % social housing, 20 % intermediate housing, 50 % market-rate housing
  • public facilities, retail space and tertiary activities
  • a political ambition of lasting social mix, against the social specialization of new neighborhoods
  • comparable projects in other French metropolitan areas whose initial social mix eroded

WHAT DIFFERS FOR EACH GROUP

  • household structure
  • income level
  • residential situation
  • residential trade-off criteria
  • sensitivity to the quality of public facilities

A MECHANISM : SOCIAL MIX IS A FLOW

Social mix is not a snapshot.
It is a trajectory.

A PROGRAMMED DISTRIBUTION, THEN INDIVIDUAL DECISIONSYEAR 0YEAR 5YEAR 1030 / 20 / 50??STAY · LEAVE · ARRIVESTAY · LEAVE · ARRIVE

Conceptual diagram. It does not represent any projected value : only the year-0 distribution, set by the program, is known.

A program can impose 30 / 20 / 50 at delivery. It does not decide what happens next : the following years are made up of individual residential decisions.

  1. 01WHAT THE PROGRAM SETSA 30 / 20 / 50 distribution at delivery. It is a starting condition, not a stable state.
  2. 02WHAT HAPPENS NEXTSome households stay, some leave, others arrive. Each of these decisions is individual.
  3. 03WHAT THIS CHANGESThe neighborhood’s social composition reshapes itself year after year, without any planning decision being replayed.
  4. 04WHAT THIS SHIFTSThe question is no longer the share of planned housing, but what changes decisions to stay, leave or move in.

THE INSUFFICIENT VARIABLE

Building social mix
is not
making social mix last.

The programmed distribution solves the first-day question. It says nothing about the mechanisms that, over ten years, retain or drive away households. These mechanisms are known individually. Their interactions were what remained to be established.

WHAT THE PROGRAM PRODUCES

Social mix on day 1. The delivered neighborhood meets the political objectives: 30 % social, 20 % intermediate, 50 % market-rate.

WHAT IT DOES NOT PRODUCE

Duration. The drift mechanisms documented in comparable developments do not concern the initial distribution.

WHAT IS AT STAKE

Perceived quality of public facilities, school, perceived safety, retail dynamics, residential trajectories, neighborhood perception.

WHAT REMAINED TO BE ESTABLISHED

Their interactions were not understood. The challenge was to determine which ones are genuinely structuring over time.

WHAT IS TESTED

Six configurations
of urban programming.

The six configurations combine the dimensions below. Several neighborhood configurations produce several population trajectories — it was this difference in trajectory, not the state at delivery, that was the object of the simulation.

  1. 01RESIDENTIAL PROGRAMMINGThe distribution between social, intermediate and market-rate housing within the 2 800 homes.
  2. 02PUBLIC-FACILITY SIZINGFacilities sized for the expected population, or sized to the standard of the metropolitan area’s more affluent neighborhoods.
  3. 03PRIMARY SCHOOL PROJECTEnhanced educational capacity, educational support arrangement, structuring educational project — or a standard school.
  4. 04RETAIL PROGRAMMINGPrestige programming — premium brands, high-end dining, exclusive cultural offer — or mixed programming.
  5. 05GREEN SPACES AND SPORTS FACILITIESGenerosity and quality of the neighborhood’s green spaces and sports facilities.
  6. 06LOCAL SAFETY ARRANGEMENTPresence and nature of the safety arrangement, which shapes perceived safety in the neighborhood.

4 200 synthetic households were interviewed individually on the 6 urban-programming configurations, with dynamic follow-ups on residential trade-off criteria. Trajectories were projected over 120 months, modeling population, schooling, retail-activity and perceived-safety dynamics.

A neighborhood
does not receive
a population.
It receives
several.

SIMULATED POPULATION

The reconstructed population covers 1,4 million residents and workers in the metropolitan area, calibrated on public INSEE data, metropolitan surveys on residential trajectories and qualitative studies of social-mix dynamics in new European neighborhoods.

It is structured into 18 profiles crossing household structure, income level, residential situation, residential trade-off criteria and sensitivity to the quality of public facilities.

  • FAMILIES WITH CHILDREN

    residential decisions are driven largely by schooling

  • HIGH-MOBILITY MARKET-RATE HOUSEHOLDS

    greatest ability to choose, therefore the earliest departures

  • SOCIAL-HOUSING HOUSEHOLDS, MORE STABLE

    constrained residential mobility, longer settlement horizon

  • WORKERS SENSITIVE TO PROXIMITY

    trade-off centered on access to jobs and services in the metropolitan core

  • HOUSEHOLDS DECIDING ON THE BASIS OF SCHOOL

    perceived quality of the primary school outweighs other criteria

  • HOUSEHOLDS SENSITIVE TO SERVICES AND SHOPS

    the local retail offer weighs on the decision to stay

  • HOUSEHOLDS SENSITIVE TO PERCEIVED SAFETY

    the local safety arrangement matters more than the facility itself

  • INTERMEDIATE HOUSEHOLDS

    the most finely balanced trade-off between housing cost and facility quality

These configurations make part of the population’s heterogeneity visible. The simulation concerns synthetic individuals, not a few persona types : the population is not reduced to lower-income households versus affluent households, but to distinct residential trade-off logics.

REACTIONS

Sizing the facilities
for the expected population
was not enough.

  1. 01

    STRICT SIZING ERODES SOCIAL MIX

    Our system identified a structural dynamic: the initial social mix of a new neighborhood erodes when public facilities — school, sports facilities, green spaces, safety arrangements — are sized strictly for the expected program. Market-rate households, the first able to choose where they live, leave the neighborhood as soon as the perceived quality of facilities deteriorates.

  2. 02

    A HIGHER STANDARD REVERSES THE DYNAMIC

    Sizing public facilities to the standard of the metropolitan area’s more affluent neighborhoods, regardless of the neighborhood’s social program, reverses this dynamic: market-rate households stay, social mix holds. Equal sizing to the expected population is therefore not equal trajectory.

  3. 03

    ONE VARIABLE OUTWEIGHS THE OTHER TWENTY-ONE

    Among the 22 variables tested on the 120-month population trajectory, one structurally dominates: perceived quality of the neighborhood’s primary school. The other variables are secondary. This result applies to this project and this simulated population; it is not stated as a general law of new neighborhoods.

  4. 04

    MIXED RETAIL PROGRAMMING IS MORE STABLE

    Prestige programming initially attracts market-rate households, but creates a retail exodus at 5 years when lower-income households cannot afford it and it loses its local customer base. Mixed programming — accessible neighborhood shops, dining at varied price points, popular cultural offerings — produces a stable retail trajectory at 120 months and supports residential social mix.

Equal sizing is not necessarily equal trajectory. A facility calibrated exactly to the expected population is compliant ; it is not necessarily stabilizing.

22 VARIABLES, ONE DOMINANT VARIABLE

Social mix did not hold
because of the percentage
of housing.
It held because
of the school.

Among the 22 variables tested, one structurally dominates the 10-year population trajectory : perceived quality of the neighborhood’s primary school. This result applies to this project and this simulated population.

It says nothing about the actual quality of the schools concerned : the modeled variable is a perception, and its effect is residential behavior.

  • PERCEPTIONThe neighborhood’s public school is perceived as deteriorating by some market-rate households with children.
  • ADAPTATIONThese households send their children to private school. At this stage, they have not left the neighborhood: nothing appears yet in the population indicators.
  • DEPARTUREThey move within an average of 4 years. The decision becomes visible well after the cause that produced it.
  • NEW POPULATIONThe vacated homes are reoccupied by households whose trade-offs differ from those of the departing households.
  • TRAJECTORYThe neighborhood’s social composition shifts without any planning decision having changed in the meantime.
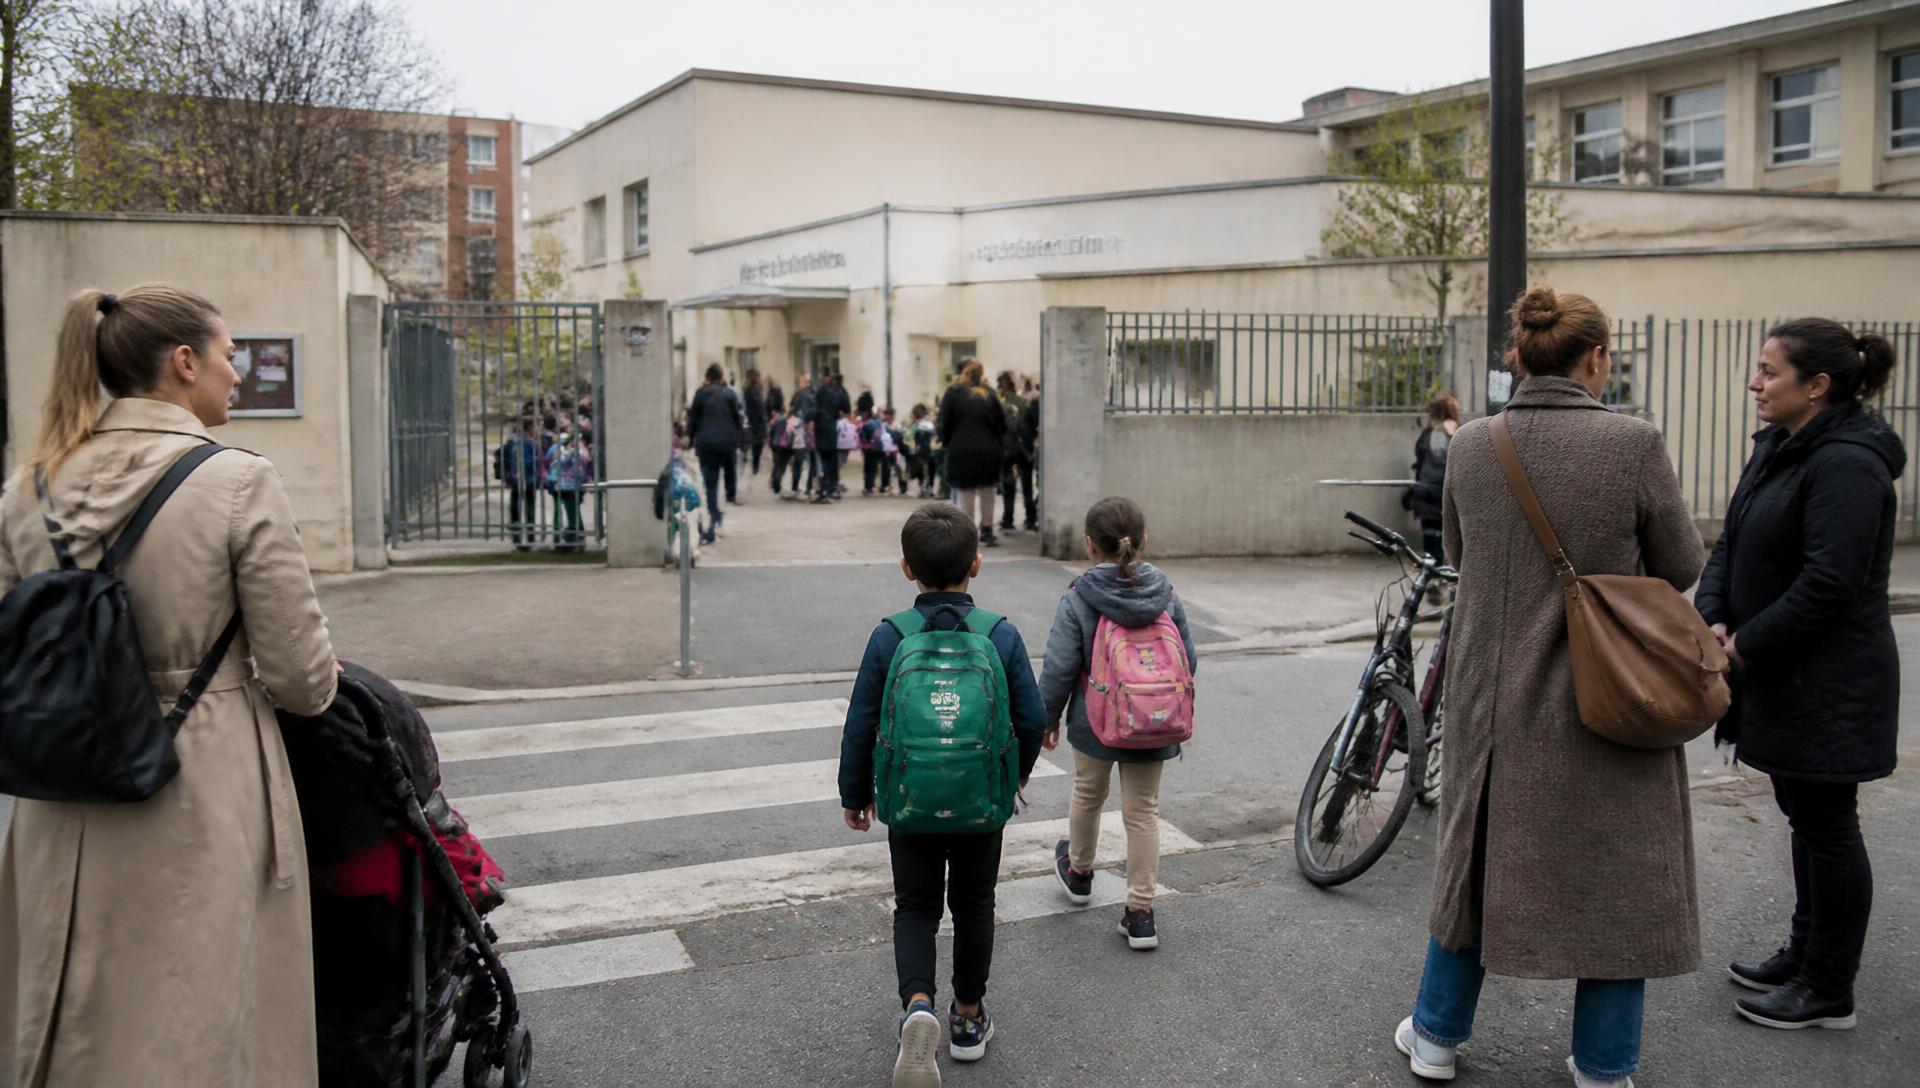
Entrance to a public primary school in an urban neighborhood at arrival time: parents and children crossing the street, school bags, a parked bicycle, adults talking on the sidewalk.
An urban-programming decision can play out every morning outside a school. For the developer, it is a facility. For households, it is the first decision criterion.

TIME LAG

A cause visible today,
an effect visible four years later.

TODAY

The neighborhood’s public school is perceived as deteriorating.

THEN

Market-rate households with children send them to private school.

LATER

They move, after an average of around four years.

FINALLY

The neighborhood’s social structure changes.

The most structuring effect is not immediate. An indicator measured at delivery, or even at twelve months, would not have captured it.

RETAIL PROGRAMMING

A shop that attracts people
at the opening
is not necessarily a shop
that sustains the neighborhood.

Two retail-programming approaches were compared. They do not differ in their initial attractiveness, but in the population that can actually use them over time.

PRESTIGE PROGRAMMING

Premium brands, high-end dining, exclusive cultural offer. Initially attracts market-rate households.

WHAT HAPPENS AT 5 YEARS

Retail exodus: the offer becomes inaccessible to some residents and loses its local customer base.

MIXED PROGRAMMING

Accessible neighborhood shops, dining at varied price points, popular cultural offerings.

WHAT HAPPENS AT 120 MONTHS

Stable retail trajectory that supports residential social mix rather than displacing it.

THE LOOPS

Populations
change the system
they inhabit.

The mechanisms identified in this case do not operate as a linear chain but as a loop : a perception changes residential behavior, which changes the population, which changes the local offer, which in turn changes perception.

These loops are those observed in this simulation. They do not constitute a universal causal model of mixed neighborhoods.

  • STABILIZING LOOPSchool perceived as high-performing → families stay → social mix maintained → diversified retail supported by a local customer base → stable attractiveness.
  • DESTABILIZING LOOPFacilities perceived as deteriorating → departure of the most mobile households → population changes → retail offer changes → new perception of the neighborhood.

COMPARISON

Six configurations,
assessed across four dimensions.

CONFIGURATIONSOCIAL MIX AT 10 YEARSSTABILITY OF MARKET-RATE HOUSEHOLDSPERCEIVED QUALITY OF FACILITIESRETAIL STABILITY
0130 / 20 / 50 program, facilities sized for expected needlowlowlowmedium
0230 / 20 / 50 program, facilities at the standard of affluent neighborhoodsmediummediumhighmedium
03Enhanced facilities, primary school with a structuring educational projecthighhighhighmedium
04Enhanced facilities, prestige retail programmingmediummediumhighlow
05Enhanced facilities, enhanced school, mixed retail programminghighhighhighhigh
06Enhanced school only, facilities and shops at expected standardmediummediumlowmedium

Qualitative comparison derived from the simulated trajectories. No configuration is cost-free : sizing to expected need protects the development budget and weakens the trajectory ; prestige programming improves initial attractiveness and destabilizes retail at five years ; investing in the commons stabilizes the trajectory and commits the developer over the long term.

THE MOST ROBUST

30 / 20 / 50 social mix facilities at a higher standard enhanced primary school accessible mixed retail

THE MOST FRAGILE

Programmed distribution public facilities sized beyond expected need

THE EVALUATION HORIZON

The reservation rate at delivery
is not the neighborhood’s success.

WHAT IS MEASURED ON DAY 1

Compliance of the delivered program with the 30 / 20 / 50 distribution.

WHAT IS MEASURED AFTERWARDS

Who stays, who leaves, who arrives — and at what pace.

WHAT STABILIZES OR DOES NOT

The school, public facilities, the neighborhood’s retail dynamics.

WHAT THIS IMPLIES

The decision must be evaluated over the horizon on which its consequences appear, here projected over 120 months.

DECISION

What the decision
selected.

TO KEEP
The initial social-mix program, 30 % social, 20 % intermediate, 50 % market-rate.
TO OVERSIZE
Public facilities, to the standard of the metropolitan area’s affluent neighborhoods.
TO STRENGTHEN
The primary school: enhanced educational capacity and a structuring educational project.
TO PROGRAM
A mixed and accessible retail offer: neighborhood shops, varied dining, popular culture.
TO GOVERN
The trajectory, through a monitoring arrangement for indicators at 12, 36 and 60 months.

PROJECTION, THEN OBSERVATION

Then reality
happened.

The developer selected the strategy combining social-mix programming according to the initial political objectives (30 / 20 / 50), public facilities sized to the standard of the metropolitan area’s affluent neighborhoods — enhanced primary school with a structuring educational project, high-quality sports facilities, generous green spaces, local safety arrangement —, mixed retail programming, and governance of social mix through a monitoring system for trajectory indicators at 12, 36 and 60 months.

At 48 months from rollout, on delivery of the first phases, the programmed social mix is effectively in place. Perceived quality of the public school reaches the standard of the metropolitan area’s affluent neighborhoods. The exodus of market-rate households is zero at this stage. The monitoring arrangement is operational, with a review every 36 months. The methodology has been adopted by the developer for two other mixed-neighborhood projects in preparation.

This result is an observation at 48 months. It does not demonstrate the trajectory at 120 months, which remains a projection. The gap between the two is precisely what the monitoring arrangement is designed to measure.
EFFECTIVE SOCIAL MIX AT 48 MONTHS
30 / 20 / 50, consistent with the program
EXODUS OF MARKET-RATE HOUSEHOLDS AT 48 MONTHS
none, versus 12 % under standard programming
PERCEIVED QUALITY OF THE PUBLIC SCHOOL
standard of affluent neighborhoods reached
METHOD REPLICATION
2 other mixed-neighborhood projects in preparation

TAKEAWAY

The programmed social mix
was a starting
condition.
Public facilities
determined the trajectory.

The problem was not building a mixed neighborhood. Programming was enough for that. The problem was giving households that could leave a reason to stay — and that reason had nothing to do with the housing distribution.

It depended on public facilities sized above expected need, a primary school built around a structuring educational project, and a retail offer that all residents could use. These parameters do not appear in the political objectives of a development operation. Yet they determine its trajectory.

POSSIBLE FUTURES

The same neighborhood.
Three ways to program it.

A

PROGRAM SOCIAL MIX

30 / 20 / 50 distribution and public facilities sized for expected need

  • political social-mix objective achieved at delivery
  • development cost and program kept under control
  • possible deterioration in perceived facility quality
  • departure of households with the greatest ability to choose

B

ATTRACT THROUGH PRESTIGE

Facilities and retail programming oriented toward attracting market-rate households

  • strong initial desirability of the neighborhood
  • easier commercialization at delivery
  • retail offer inaccessible to some residents, retail exodus at 5 years
  • population imbalance and risk of specialization through gentrification

C

INVEST IN THE COMMONS

30 / 20 / 50 social mix, facilities at a higher standard, enhanced school, mixed retail

  • market-rate households stay, social mix holds
  • stable retail trajectory at 120 months
  • higher initial investment in public facilities
  • governance to sustain over the long term, with reviews at 12, 36 and 60 months

METHOD

Before recommending,
we tested reactions.

  1. DECISION
  2. 1,4 M RESIDENTS & WORKERS
  3. 6 CONFIGURATIONS
  4. 4 200 HOUSEHOLDS INTERVIEWED
  5. 120-MONTH TRAJECTORIES
  6. DECISION

Trajectories were projected over 120 months, modeling population, schooling, retail-activity and perceived-safety dynamics.

This case adds a capability to the library : simulating not only how a project is received, but how a population and its environment transform one another. Residents arrive, stay, leave, choose schools, consume, create activity, change the perception of the neighborhood — and this new composition in turn produces new behaviors.

A real case.
An unnamed developer.

This case comes from a simulation conducted for a French developer. The organization is not named, no personally identifiable data entered the system, and the detailed results remain the property of the commissioning organization. The comparisons between configurations published here are qualitative ; the quantitative values cited are those documented by the commissioning organization.

The simulation focuses exclusively on the residential trade-offs of a synthetic population faced with different urban-programming configurations. It is neither a real-estate market study, nor a housing-policy evaluation, nor a forecast of land values.

Your next decision

Which decision do you want to explore?

Describe your need. We can point you to the right level of support.

What if you tested
your next decision?

State your decision. See the future it produces.

Explore the product