OVERSIZED OFFER
- empty capacity
- high cost per user
PUBLIC POLICY · REGIONAL MOBILITY AGENCY
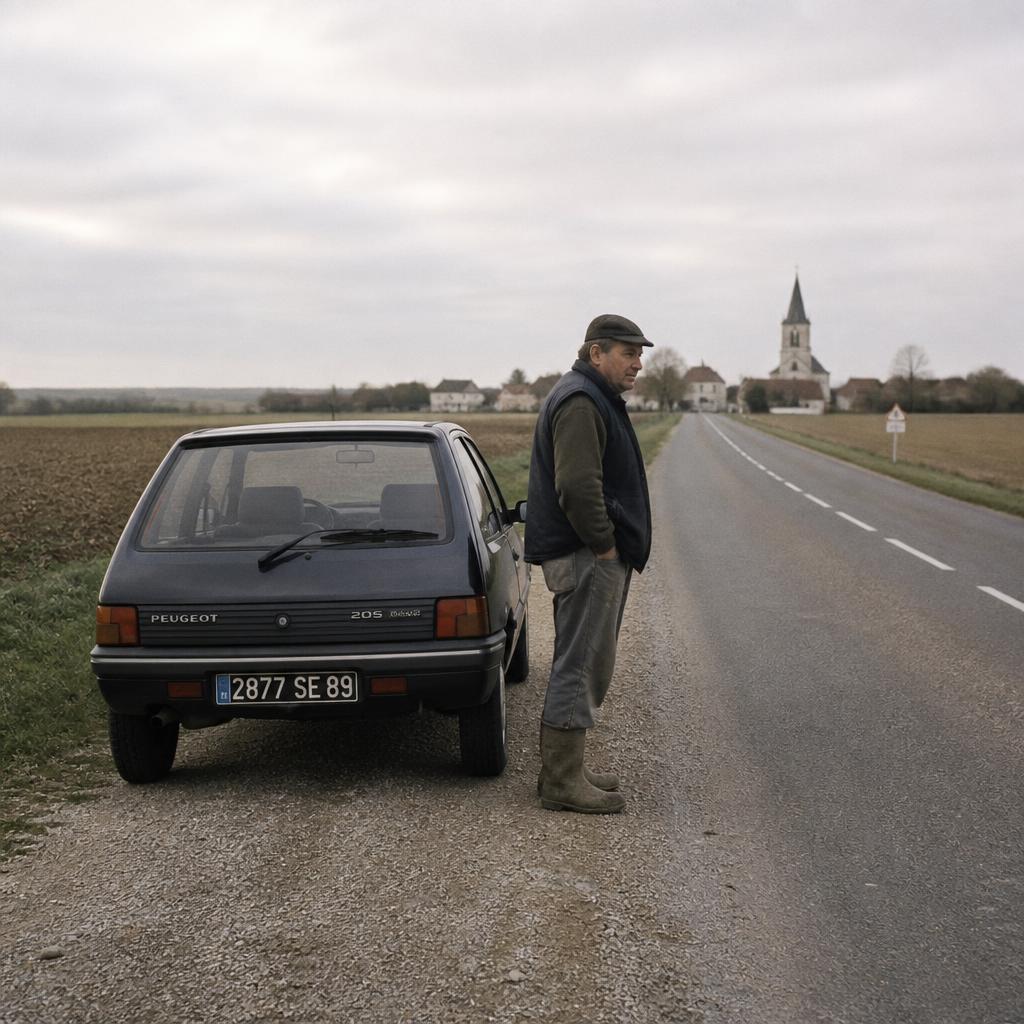
For the agency, it is a mobility offer to deploy. For a rural worker, an extremely robust solution already exists: the car.
The plan provides 82 M€ over 5 years to reach 34 % adoption at 60 months, in territories where carpooling remains below 3 %. The question is not whether the program is useful, but at what size it should open, and when.
BUDGET
82 M€ over 5 years
OBJECTIVE
34 % adoption at 60 months
STARTING POINT
Carpooling < 3 %
REGIONAL SHARED-MOBILITY PLAN
The plan covers four services deployed across rural territories in a French region. Comparable programs deployed elsewhere encountered the same difficulties: supply oversized relative to actual demand, low utilization rates, high cost per user.
The agency used our system to test different sizing and sequencing configurations, with 5-year projections of adoption trajectories by rural-worker typology.
FIRST REVELATION
— simulated adoption trajectory· · · assumed linear progression| signal event
Communication does not necessarily create the moment of adoption. It can prepare the population to use the service when their context changes.
“The goal was not to manufacture demand artificially. It was to be ready when it emerged.”
MECHANISM
A linear adoption model would be misleading: it assumes continuous progression, whereas each transition from one stage to the next depends on an event external to the program. As long as the car routine holds, the next stage is not triggered.
SIMULATED POPULATION
The population was structured into 11 typologies of relationship to rural solo driving, crossing age, work constraints, family structure, distance to the village center and relationship to collective services.
3 200 synthetic workers were interviewed on the 5 configurations tested, with dynamic follow-ups on tipping points.
WORKERS WITH HIGH SCHEDULE CONSTRAINTS
shifted or variable schedules, low compatibility with planned sharing
WORKERS FAR FROM THE VILLAGE CENTER
long daily distances, strong dependence on the personal vehicle
WORKERS CLOSE TO THE VILLAGE CENTER
short journeys, alternatives more easily available
SINGLE-VEHICLE HOUSEHOLDS
internal trade-offs among household members over use of the car
MULTI-VEHICLE HOUSEHOLDS
established solo driving, low pressure to change
YOUNG WORKERS
greater sensitivity to vehicle cost, more open relationship to shared services
WORKERS NEARING THE END OF THEIR CAREERS
long-established routines, low reversibility
FAMILIES WITH DEPENDENT CHILDREN
complex trip chains, low tolerance for uncertainty
DISTANT FROM COLLECTIVE MOBILITY SERVICES
low familiarity with organized services, late entry into use
These configurations reveal part of the population's heterogeneity. The simulation operates on synthetic individuals, not a handful of persona types.
THE 5 CONFIGURATIONS
The five configurations were tested against the same population to isolate the effect of available capacity, expansion speed, service sequencing and communication framing.
IMMEDIATE SIZING FOR 15 %
34 % of capacity used
over the first three years
SIZING 8 % → 22 % IN 6 MONTHS
78 % of capacity used
cost per user 2,4 times lower
More capacity better policy.
SECOND REVELATION
OVERSIZED OFFER
OFFER CALIBRATED TO INITIAL DEMAND
“The infrastructure had to be small at first and fast afterward.”
THIRD REVELATION
CLASSIC COMMUNICATION
“Use shared mobility.”
Low adoption between waves.
RECOMMENDED COMMUNICATION
“When you need it, here is how it works.”
3,4× more adoption when actual waves occur.
PROMOTE PREPARE
METHOD
ADOPTION PROGRESSES IN WAVES, NOT CONTINUOUSLY
The waves are triggered by signal events external to the program. Between two waves, adoption stagnates, regardless of the intensity of institutional communication.
SCALABLE SIZING IS MORE COST-EFFECTIVE THAN IMMEDIATE SIZING
8 % with expansion to 22 % in 6 months: 78 % capacity utilization and a cost per user 2,4 times lower than a program sized immediately for 15 %, which uses 34 % of its capacity.
COMMUNICATION SHOULD PREPARE FOR WAVES, NOT PROMOTE USE
The explanatory framing “when you need it, here is how it works” generates 3,4 times more adoption when actual waves occur.
Imagine All The People does not ask a model to imagine what a rural worker might think about carpooling. Five sizing configurations are tested against a coherent and heterogeneous synthetic population, with signal events modeled, in order to observe possible trajectories before the decision is made.
STRATEGY SELECTED
THEN REALITY ARRIVED
SIMULATION
5-year adoption projection: 12 %34 % with the recommended program. 22 % projected at 36 months.
OBSERVATION
24 % cumulative adoption at 36 months, more than 82 % utilization of expanded capacity, cost per user 42 % lower.
TAKEAWAY
“The policy therefore had to be designed to absorb waves, not to manufacture a linear progression that did not exist.”
This case is based on a completed simulation. The organization and location are not named where confidentiality requires it. The decision, configurations tested and findings are presented without revealing information that could identify the client.
Your next decision
Describe your need. We can point you to the right level of support.
State your decision. See the future it produces.