RETAIL · TRANSFORMATION

“Anticipating the evolution of the bulk-goods aisle over 5 years in a general grocery chain.”

A European food retailer, 340 general grocery stores, €3.8B in revenue, needed to size the bulk-goods aisle across its estate for a 5-year horizon. Adoption was rising continuously but unevenly: 6% of shoppers in the observation year, versus 4% three years earlier. Sector studies projected 15% to 22% at a 5-year horizon depending on the scenario.

The question wasn't whether consumers liked bulk goods. It was how much space to give it today, when its real adoption will play out over the next five years.

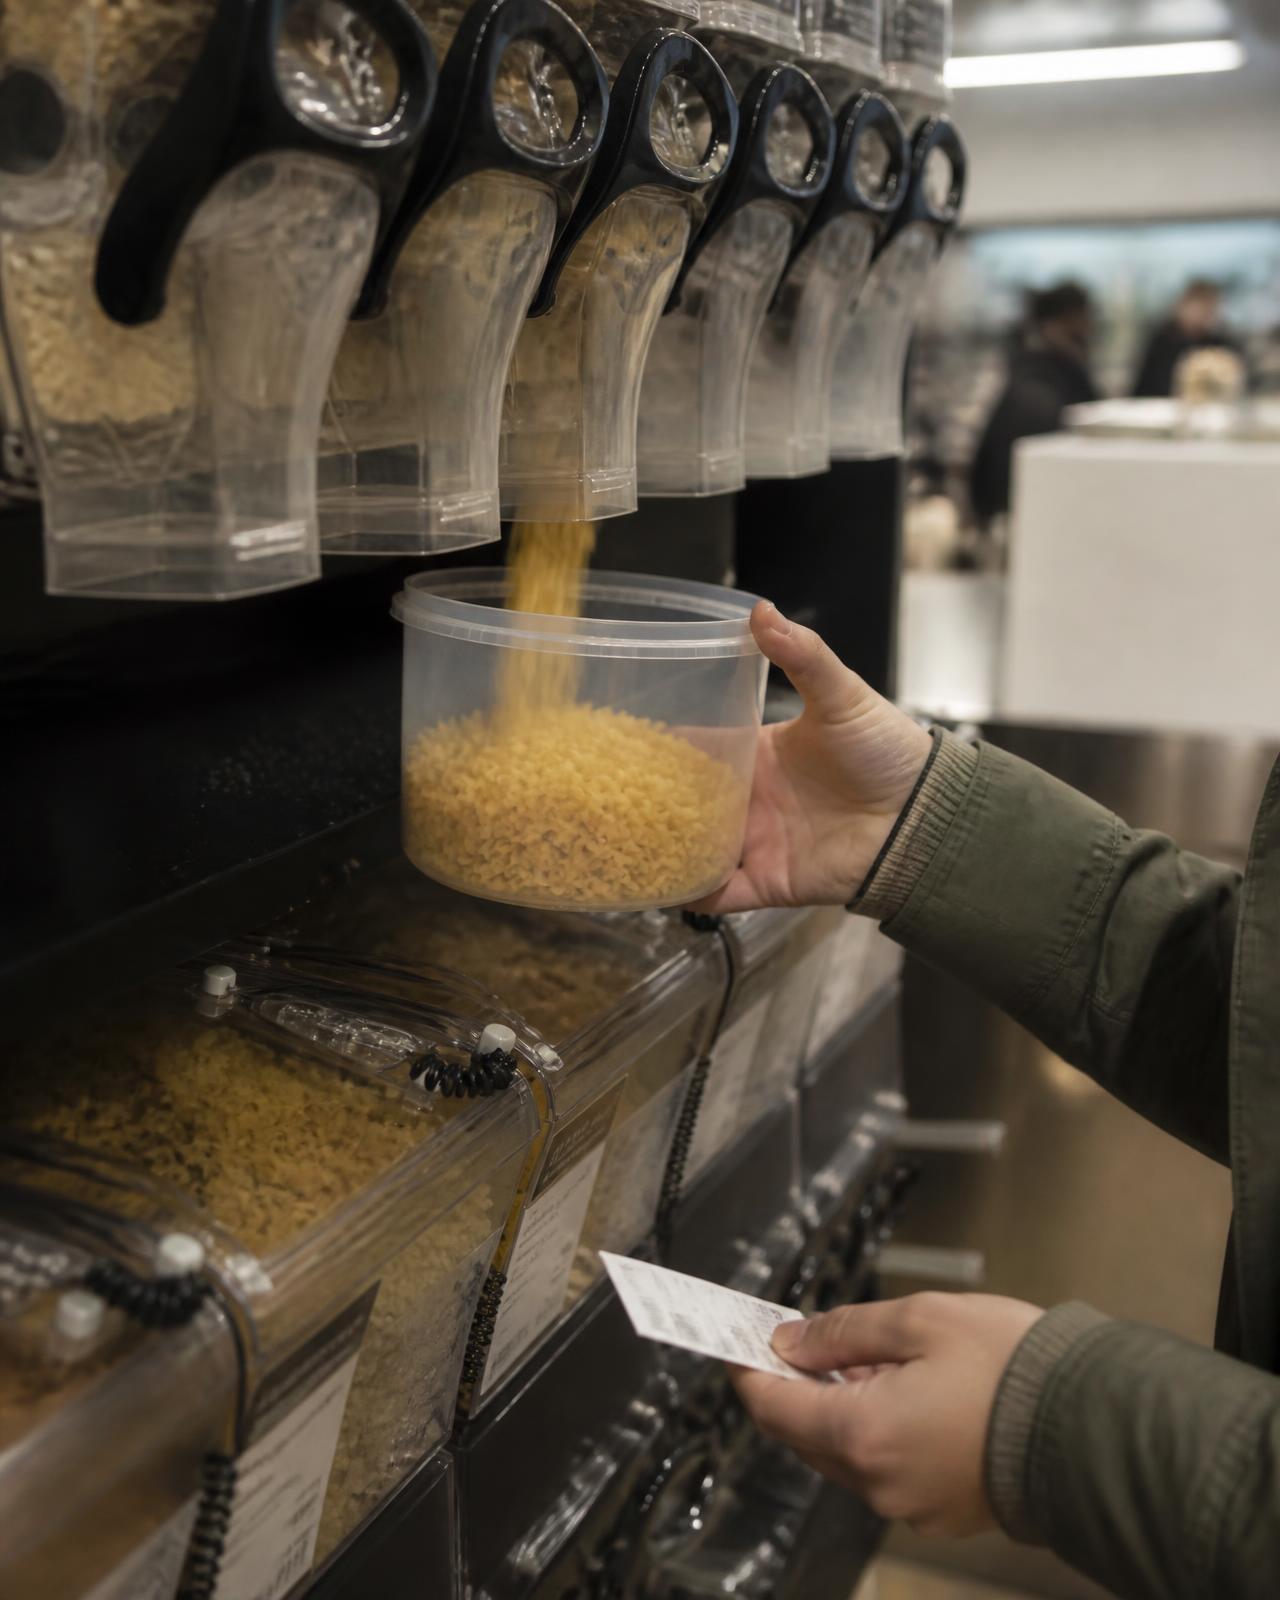
Close-up of a customer's hands filling a reusable container with pasta at a bulk-goods dispenser in a supermarket, a weighing ticket in the other hand.
DECISION
Size the bulk-goods aisle across 340 general grocery stores for a 5-year horizon
POPULATION
3.4 million synthetic food shoppers, 13 profiles of relationship to bulk goods
WHAT IS TESTED
4 sizing configurations, several signal-event scenarios
HORIZON
60 months of projected trajectories

THE PROBLEM

An intention
does not automatically

become

a purchasing habit.

The sizing risk was structural. An undersized aisle would slow adoption and let customers shift to more committed competitors. An oversized aisle would tie up retail space that is profitable on other categories and generate fixed costs not covered by actual sales, hurting the store's operating margin.

Between these two errors, the available information was a trend: growth from 4% to 6% over three years, and sector projections ranging from 15% to 22% at five years. A trend describes what has happened. It doesn't say which uses will take hold, disappear, or transform as bulk goods move from a positive intention to a repeated everyday practice.

Merchandising leadership brought in our system to test different sizing scenarios, with particular attention to the scalability of the setup and to modeling the signal events likely to accelerate adoption.

WHAT IS ESTABLISHED

  • an estate of 340 general grocery stores, €3.8B in revenue
  • an average adoption rate of 6% of shoppers in the observation year
  • a rate of 4% three years earlier: the growth is real but uneven
  • sector studies projecting 15% to 22% adoption at a 5-year horizon
  • retail space that is profitable on other categories, hence a tie-up cost
  • an investment decision to make before knowing what will take hold

WHAT DIFFERS FOR EACH PERSON

  • relationship to bulk goods: active convert, occasional browser, indifferent, explicit rejector
  • the retailer's proprietary consumption history
  • sensitivity to novelty
  • shopping frequency and organization
  • exposure to signal events in the catchment area
  • proximity to a competing offer committed to bulk goods

A VARIABLE: TRYING IS NOT ADOPTING

The first purchase
and the habit

are not

the same step.

A FAVORABLE INTENTION IS NOT YET A PURCHASING HABITDECLARED INTERESTFIRST TRIAL IN AISLESECOND PURCHASESETTLING INTO THE ROUTINEOR RETURN TO PACKAGED GOODS

Conceptual diagram. It represents no measured value: it only maps the steps between a declared interest and a use embedded in a shopping routine.

The case documents the point that matters for the decision: between two external triggers, adoption stalls. A retail innovation can therefore generate trials without generating, at the same pace, durable uses.

  1. 01WHAT AN INTENTION SURVEY MEASURESThe level of declared interest in bulk goods, at a given moment, outside a purchasing situation.
  2. 02WHAT A FIRST PURCHASE MEASURESThe aisle's ability to trigger a trial. The case observes a 6% adoption rate among shoppers, versus 4% three years earlier.
  3. 03WHAT REPETITION MEASURESWhat remains after several weeks: the share of uses that genuinely settle into a shopping routine.
  4. 04WHAT THE CASE SHOWSBetween two external triggers, adoption stalls. Growth is not produced by the accumulation of isolated trials.

CUMULATIVE FRICTION

The cost
of a friction

also depends

on its frequency.

An extra step is negligible once. Repeated on every store visit, it enters a household's organization. It is this repetition, not the initial trial, that determines what an aisle becomes over five years.

  • AN EXTRA STEPBringing a container, weighing it, labeling it: each gesture adds to the usual shopping trip.
  • A FREQUENCYThis gesture is not performed once. It is performed on every visit, for the entire life of the habit.
  • A CUMULATIVE COSTA negligible friction at the first purchase weighs differently once it repeats within a household's organization.
  • WHAT THIS MEANS FOR THE DECISIONSizing an aisle isn't about the number of trials triggered, but about the share of uses able to hold over time.

THE INSUFFICIENT QUESTION

“Do people
like bulk goods?”

sizes nothing.

Support for the idea of bulk goods was already known to the retailer. It did not help arbitrate between space committed today and a use that will be decided over five years of ordinary shopping.

THE QUESTION USUALLY ASKED

“Are consumers favorable to bulk goods?” Support for the idea was already documented: it did not help size an aisle.

THE QUESTION ACTUALLY ASKED

“Anticipate the evolution of the bulk-goods aisle over 5 years in a general grocery chain.” In other words: how much space to commit today for a use that will be decided later?

WHAT THE CASE SHOWS

Sector studies projected 15% to 22% adoption at 5 years. The simulation shows that the trajectory is not continuous, but made of plateaus and waves.

WHAT THIS IMPLIES

An observed trend does not mechanically extend. It depends on external events and on the retailer's ability to absorb them.

WHAT IS TESTED

Four sizing
configurations.

What varies is not the principle of bulk goods, but how to make it practicable and sustainable: initial capacity, extension capacity, monitoring setup, pre-negotiated extension plans. Several signal-event scenarios were modeled in parallel.

  1. 01AISLE SIZED FOR 15% FROM THE OUTSETThe capacity projected by sector studies is installed from the start, across the whole estate.
  2. 02AISLE SIZED FOR 8%, EXTENDABLE TO 22%A reduced initial capacity, paired with infrastructure ready to scale to 22% within 6 months: modular containers, a reserve supply chain, staff training.
  3. 03MONITORING SETUP FOR SIGNAL EVENTSA dedicated unit within merchandising, tasked with detecting triggers and ordering the extension.
  4. 04PRE-NEGOTIATED EXTENSION PLANSPrior agreements with suppliers and store teams, so the extension is executable within the 6-month window.
  5. 05SIGNAL-EVENT SCENARIOSNew public policy on packaging, a sustained rise in packaged-goods prices, a media event on plastic pollution, the arrival of a 100% bulk-goods competitor in the catchment area.

4,200 synthetic shoppers were interviewed individually on the 4 sizing configurations tested, with several signal-event scenarios modeled — new public policy, price increase, media event, competitor arrival. Trajectories were projected over 60 months with identification of monthly tipping points and modeling of conversion dynamics by typology.

A population
is not

“bulk-goods

consumers.”

SIMULATED POPULATION

The reconstructed population covers 3.4 million European food shoppers, calibrated on the retailer's proprietary data — proprietary segments, consumption history, sensitivity to novelty — and on European sector studies of food retail.

It is structured into 13 profiles of relationship to bulk goods: active converts, occasional browsers, indifferent shoppers, explicit rejectors, and several intermediate typologies calibrated on qualitative sector studies. It is this heterogeneity that determines what repeats and what stops.

  • ACTIVE CONVERTS

    bulk goods are already embedded in the shopping organization

  • OCCASIONAL BROWSERS

    the trial has happened, repetition remains open

  • INDIFFERENT SHOPPERS

    neither militant support nor rejection: the aisle doesn't enter the trip

  • EXPLICIT REJECTORS

    a configuration where no facilitation triggers the trial

  • INTERMEDIATE TYPOLOGIES

    several states between curiosity and conversion, calibrated on qualitative sector studies

  • CONSUMPTION HISTORY

    the retailer's proprietary data shapes the relationship to novelty

  • SENSITIVITY TO NOVELTY

    it determines who reacts first to a signal event

  • COMPETITIVE EXPOSURE

    the presence of a committed offer in the catchment area shifts the trade-off

These configurations make part of the population's heterogeneity visible. The simulation runs on synthetic individuals, not on a handful of persona archetypes: these are not representative figures, but distinct situations, constraints and options.

REACTIONS

What moves
adoption

is not

the installed footprint.

  1. 01

    ADOPTION PROGRESSES THROUGH TRIGGERS, NOT LINEARLY

    The simulation identifies a recurring dynamic: bulk-goods adoption does not follow a continuous progression but successive triggers, correlated with external events — public policy on packaging, a sustained rise in packaged-goods prices, a media event on plastic pollution, the arrival of a 100% bulk-goods competitor in the catchment area. Between these triggers, adoption stalls.

  2. 02

    AN OVERSIZED AISLE DOES NOT ACCELERATE USE

    An aisle sized for 15% adoption from the outset generates an average utilization rate of 42% of its capacity over the first three years. The cost per unit sold is high, and retail space that is profitable on other categories stays tied up. Installed capacity does not produce the habit.

  3. 03

    EXTENDABLE CAPACITY CAPTURES WAVES BETTER THAN INSTALLED CAPACITY

    An aisle initially sized for 8%, with infrastructure ready to scale to 22% within 6 months, generates an average utilization rate of 78% of its effective capacity. The logistics cost per unit sold is 42% lower, and revenue at the moment of adoption waves is captured without degradation.

  4. 04

    THE MONITORING SETUP IS THE REAL DECISION PARAMETER

    The structural parameter is not the initial sizing, but the quality of the monitoring setup for signal events and the ability to extend quickly. A chain equipped with an effective monitoring setup and modular infrastructure captures 78% of adoption waves at the right time. A chain without such a setup misses the waves and lets customers shift to better-prepared competitors.

42% versus 78% capacity utilization depending on the sizing mode, a logistics cost per unit sold 42% lower: these gaps apply to the same aisle, in the same estate, facing the same adoption dynamic.

60-MONTH TRAJECTORY

A trend
is not

a trajectory.

ADOPTION DOES NOT PROGRESS CONTINUOUSLY: IT PROGRESSES THROUGH TRIGGERSLINEAR EXTRAPOLATION OF A TREND6%19%21%YEAR 0INITIAL SIZINGYEAR 1PLATEAU BETWEEN TWO SIGNALSYEAR 2WAVE: PACKAGING PRICESYEAR 3WAVE: PUBLIC POLICYYEAR 5PROJECTED LEVELVALUES FROM THE CASE: 6% IN THE OBSERVATION YEAR, 19% MEASURED AT 36 MONTHS, 21% PROJECTED AT 5 YEARS WITH SCALABLE SIZING

The values shown are those documented by the case: 6% adoption in the observation year, 19% measured at 36 months after two waves, 21% projected at 5 years with scalable sizing.

The dashed line represents the continuous extrapolation of a trend. The simulated trajectory, by contrast, is made of plateaus and triggers: the strategy must be calibrated to absorb waves, not to uniformly promote usage.

An ordinary kitchen counter: a plastic box of rice, a reused jar of lentils, and a packaged bag of pasta sitting side by side.
What happens after the aisle. Whether a bulk-goods purchase repeats depends on how it fits into an existing household organization, where packaged goods remain available.

SUPPORT AND CHOICE

Supporting the idea
is not

choosing in the aisle.

The same person can consider bulk goods a good idea and keep buying packaged goods. This is not a contradiction: opinion forms outside the situation, choice happens in an actual shopping trip.

WHAT IS DECLARED

A positive association with bulk goods: less packaging, freedom of quantity, less waste.

WHAT PLAYS OUT IN THE AISLE

A situated trade-off, within a shopping trip constrained by time, household organization and available offer.

WHAT THE CASE SHOWS

The gap between 6% observed adoption and the 15% to 22% projected by sector studies is not resolved by support. It is resolved by what triggers and what retains usage.

WHAT THIS SHIFTS

The aisle is not sized on opinion. It is sized on behaviors able to repeat, and on how fast the retailer can follow when they shift.

COMPARISON

The configurations tested,
read across three dimensions.

CONFIGURATIONWAVE CAPTUREUTILIZATION RATEMODEL ECONOMICS
01Immediate sizing for 15% adoptionmediumlowlow
02Immediate sizing for 22% adoptionhighlowlow
03Sizing for 8%, no monitoring setuplowmediummedium
04Sizing for 8%, extendable to 22% within 6 months, with monitoring of signal eventshighhighhigh

Qualitative comparative reading drawn from the simulated configurations. The levels reflect the documented gaps: 42% versus 78% average capacity utilization, a logistics cost per unit sold 42% lower, an avoided tie-up of €3.8M. No configuration is without cost: a wide capacity maximizes visibility but degrades utilization and ties up profitable space; a narrow capacity without an extension mechanism risks missing a wave.

THE MOST ROBUST

Initial capacity at 8% + infrastructure extendable to 22% within 6 months + monitoring setup + pre-negotiated extension plans

THE MOST FRAGILE

Capacity installed from the outset on the sector projection with no monitoring setup for signal events

TRADE-OFF

What the decision
retained.

TO SIZE
Initial capacity on actually installed usage, i.e. 8% adoption, not on the sector projection.
TO MAKE EXTENDABLE
The infrastructure: modular containers, reserve supply chain, ongoing staff training, to scale to 22% within 6 months.
TO MONITOR
Signal events in the catchment area, through a dedicated unit within merchandising.
TO PRE-NEGOTIATE
Extension plans with suppliers and store teams, so the wave is executable within the timeframe.
TO MEASURE
Capacity utilization, rather than the committed footprint alone.

PROJECTION, THEN OBSERVATION

Then reality
arrived.

The retailer adopted the strategy combining an initial sizing for 8% adoption, a modular infrastructure ready to scale to 22% within 6 months — modular containers, a reserve supply chain, ongoing staff training —, a monitoring setup for signal events assigned to a dedicated unit within merchandising, and pre-negotiated extension plans with suppliers and store teams.

At 36 months into deployment, two adoption waves were observed: a sustained rise in packaging prices in year 2, and a new European public policy on plastics reduction in year 3. The setup absorbed both waves with a utilization rate above 76% of the extended capacity. Cumulative adoption at 36 months stands at 19%.

The logistics cost per unit sold is 38% lower than the scenario of immediate sizing at 22%. The methodology was referenced by several other European retailers for their own bulk-goods sizing strategy. These values are those documented by the client.

CUMULATIVE ADOPTION AT 36 MONTHS
19%, versus 6% in the observation year
CAPACITY UTILIZATION RATE
above 76% of extended capacity, across two absorbed waves
LOGISTICS COST PER UNIT
−38% vs. immediate sizing scenario at 22%
AVOIDED TIE-UP
−€3.8M in oversizing cost

LESSON

The problem
wasn't whether

bulk goods

appealed.

It was when

it would tip.

Support for bulk goods wasn't the missing variable. The missing variable was the shape of the trajectory: an adoption that progresses through successive triggers, correlated with external events, and that stalls between those triggers. Sizing an aisle must therefore be calibrated to absorb waves, not to uniformly promote a target use.

Two consequences for retail decision-making. The quality of the monitoring setup and the scalability of infrastructure are structurally more profitable than early oversizing. And this principle holds beyond bulk goods: structural consumption shifts — plant-based, secondhand, repair, refurbished goods, digital sobriety — share the same non-linear progression mechanic.

POSSIBLE FUTURES

The same aisle.
Three ways to commit to it.

A

GO BIG

Size from the outset for the adoption level projected by sector studies

  • maximum visibility and a clear signal of commitment
  • average utilization rate of 42% of capacity over three years
  • high cost per unit sold, profitable space tied up
  • installed capacity does not produce the habit

B

STAY CAUTIOUS

Size for current usage, with no extension infrastructure or monitoring setup

  • space savings and simple operations
  • insufficient capacity at the moment of adoption waves
  • risk of a share of customers shifting to better-prepared competitors
  • the wave's opportunity cannot be recovered after the fact

C

SIZE TO BE ABLE TO FOLLOW

Initial capacity at 8%, infrastructure extendable to 22% within 6 months, monitoring of signal events

  • average utilization rate of 78% of effective capacity
  • logistics cost per unit sold 42% lower
  • two waves absorbed at 36 months, cumulative adoption of 19%
  • depends on the quality of the monitoring setup and pre-negotiated extension plans

METHOD

Before recommending,
we made it react.

  1. DECISION
  2. POPULATION
  3. CONFIGURATIONS
  4. TRIAL & REPETITION
  5. 5-YEAR TRAJECTORIES
  6. TRADE-OFF

3.4 million synthetic food shoppers reconstructed, 13 profiles of relationship to bulk goods, 4,200 individuals interviewed across 4 sizing configurations, several signal-event scenarios modeled, and a 60-month projection with identification of monthly tipping points.

This case adds a capability to the library: simulating not the initial intention, but the trajectory that follows it. Intention, trial, repetition, abandonment or adoption, new equilibrium. A trend observed today is not enough to describe what the aisle will be in five years.

A real case.
An unnamed retailer.

This case originates from a simulation carried out for a European food retailer. The client is not named, no personal data was entered into the system, and the detailed results remain its property. The comparisons between configurations published here are qualitative; the quantitative values cited are those documented by the client.

The simulation covers exclusively purchasing behaviors and the sizing of an offer. It constitutes neither an environmental assessment of bulk goods, nor a position on their desirability. The business decision belongs to the decision-maker.

Your next decision

Which decision do you want to explore?

Describe your need. We can point you to the right level of support.

What if you tested
your next decision?

State your decision. See the future it produces.

Explore the product